logo
  • Tutorials
  • Gallery
  • API
  • References
  • Citing SAILS
  • Simulation Gallery
On this page
  • Baccala and Sameshima 2001
  • Pascual-Marqui et al 2014

Simulation Gallery

This page contains a set of figures re-created around existing papers which used simulated or analytic systems. These graphs are provided for comparison with the original papers.

The code for generating these figures can be found in sim_gallery.py.

Baccala and Sameshima 2001

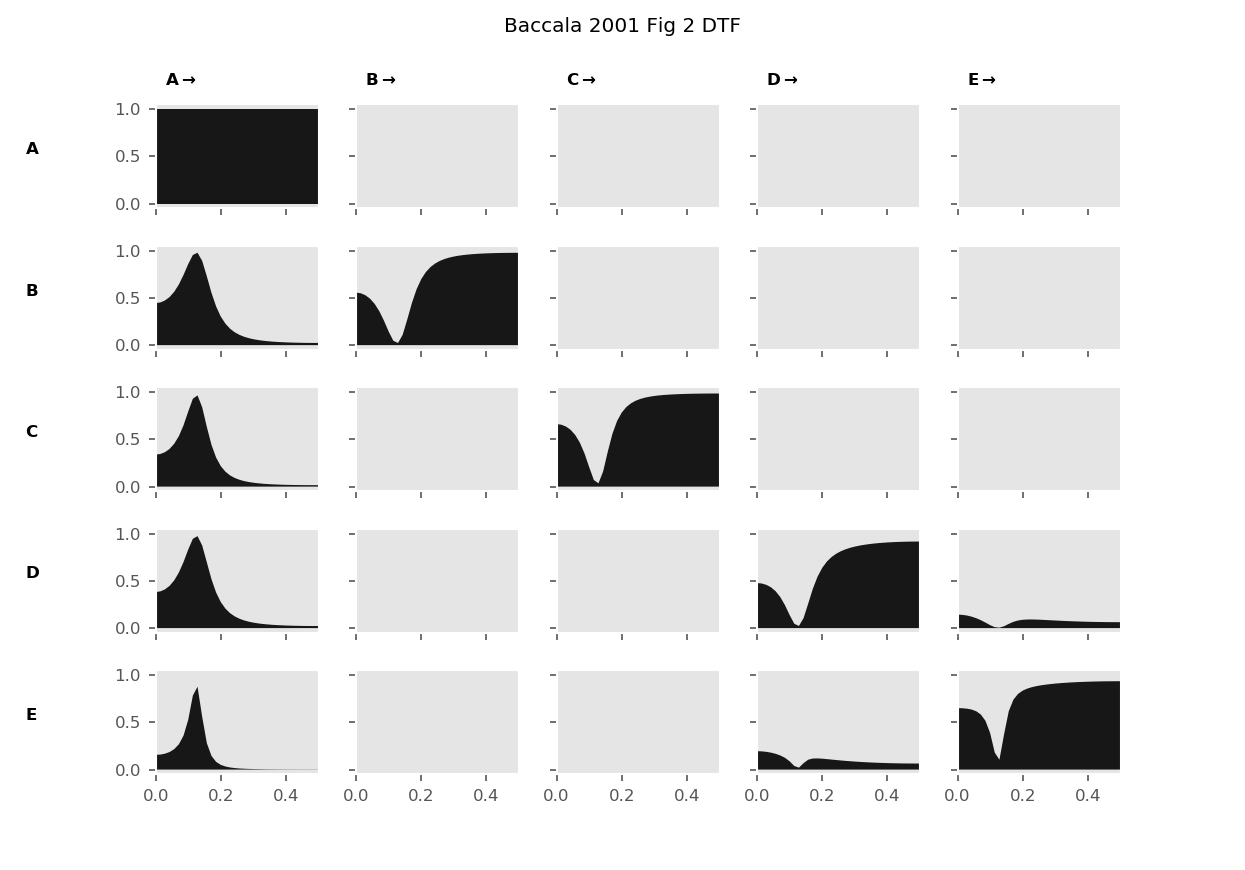
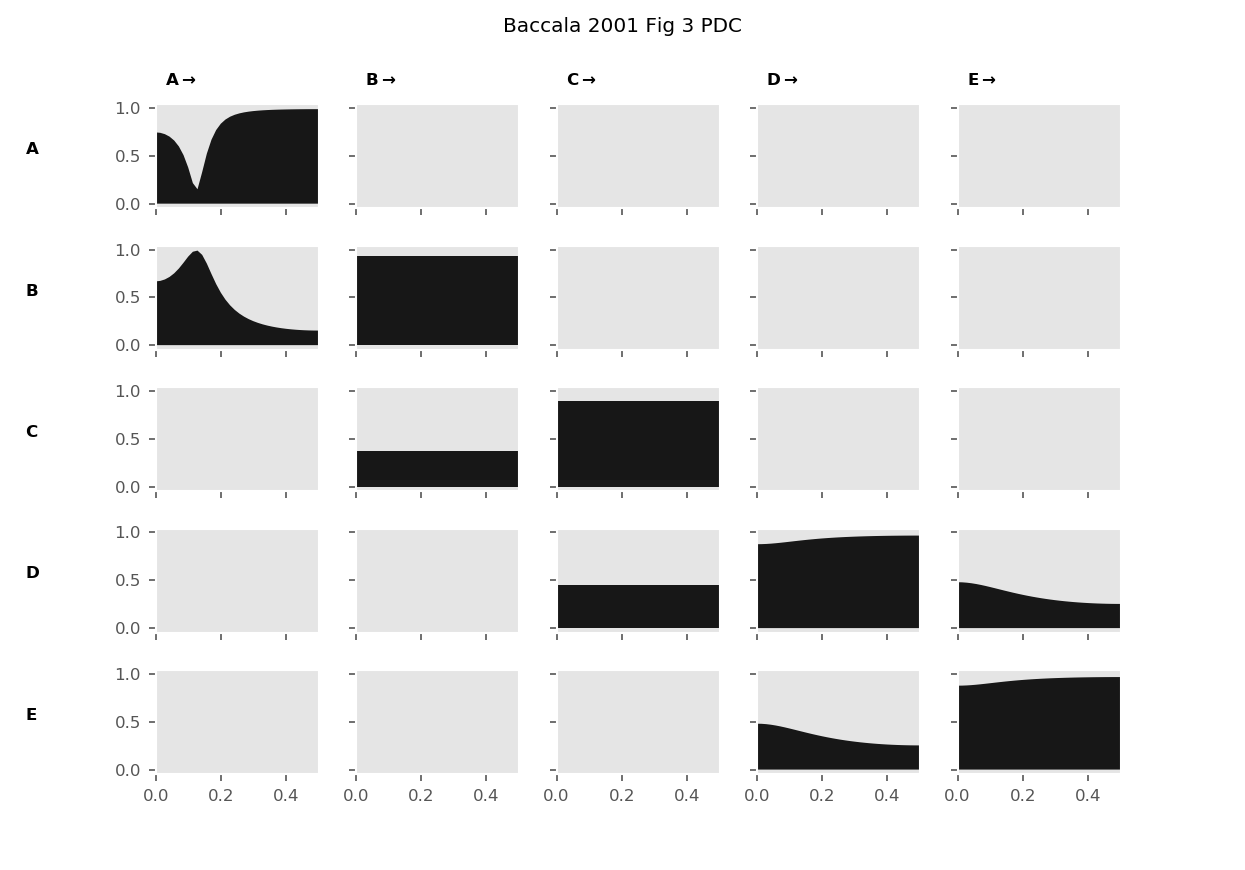
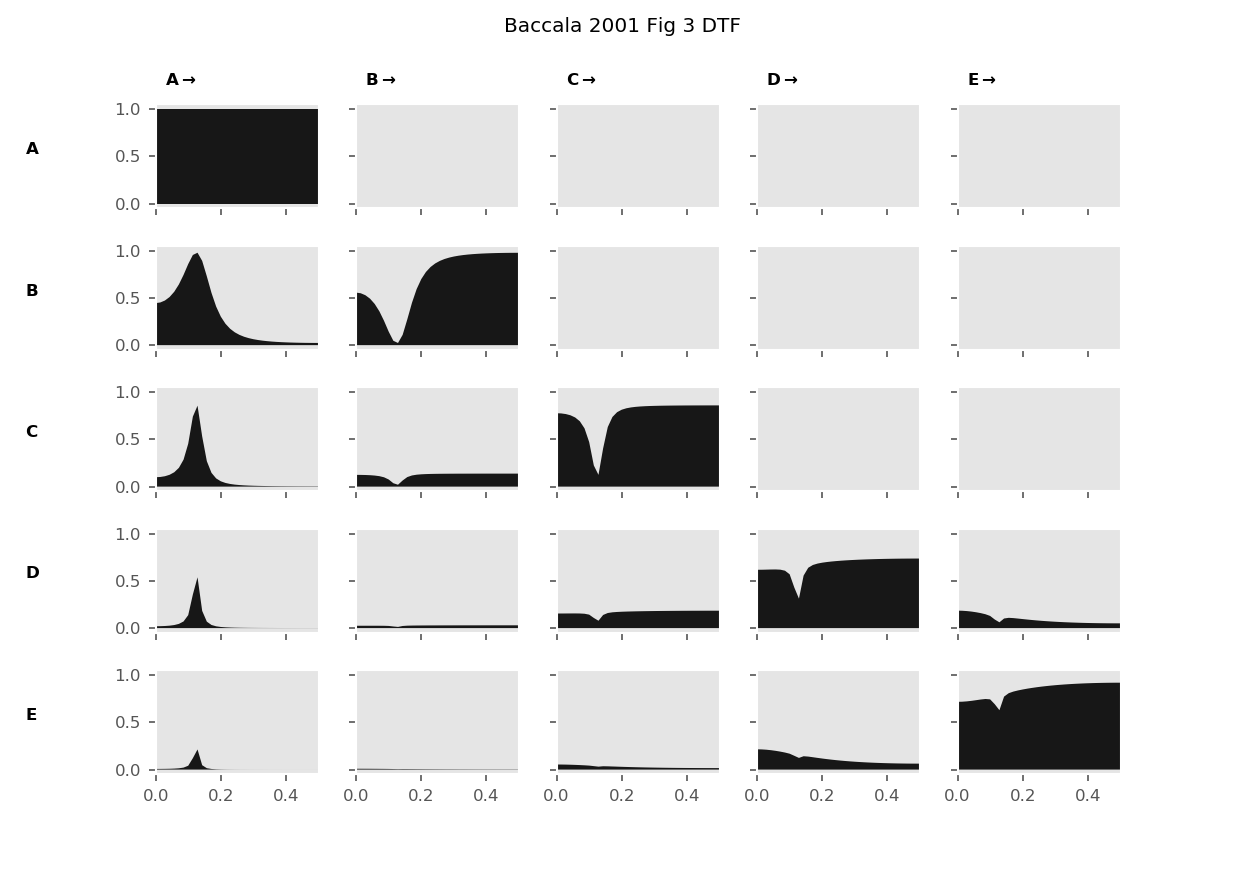
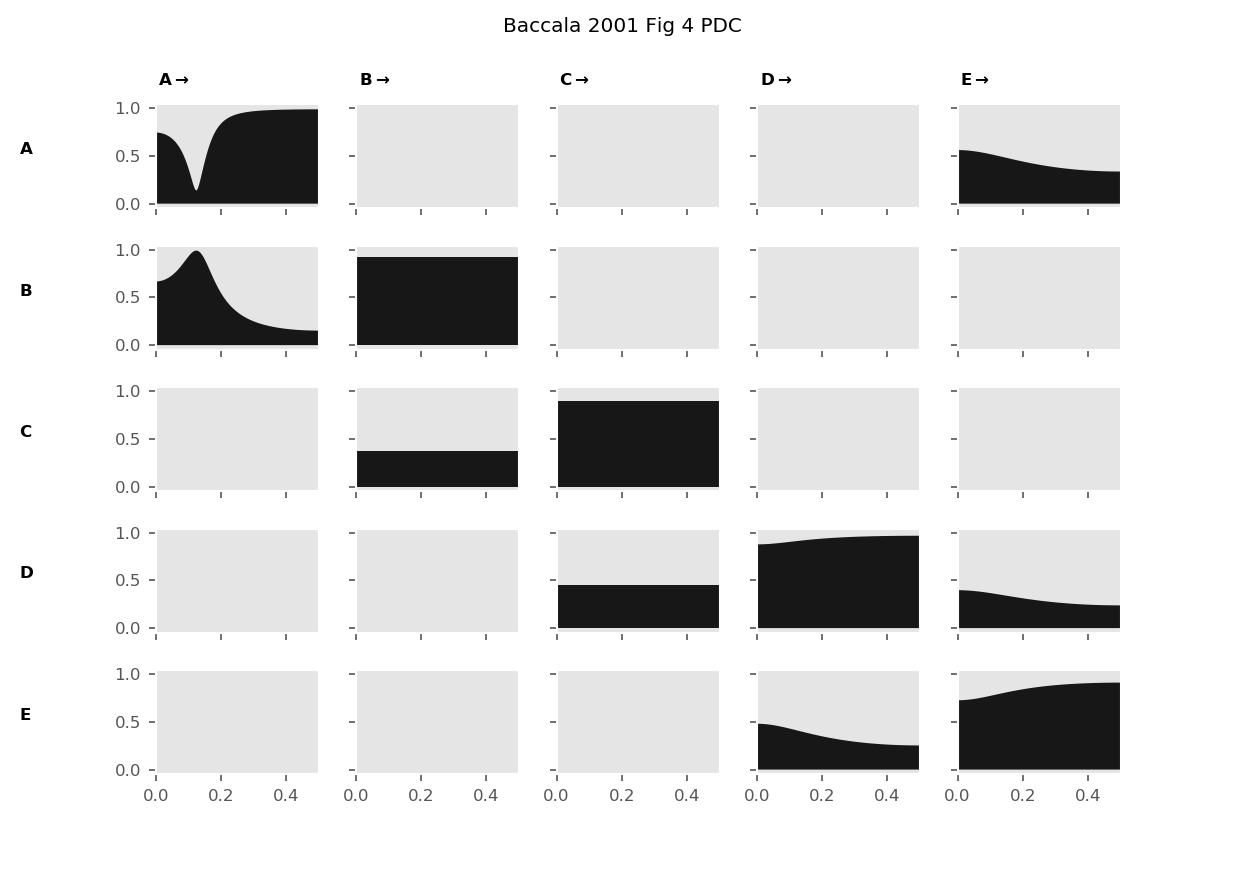
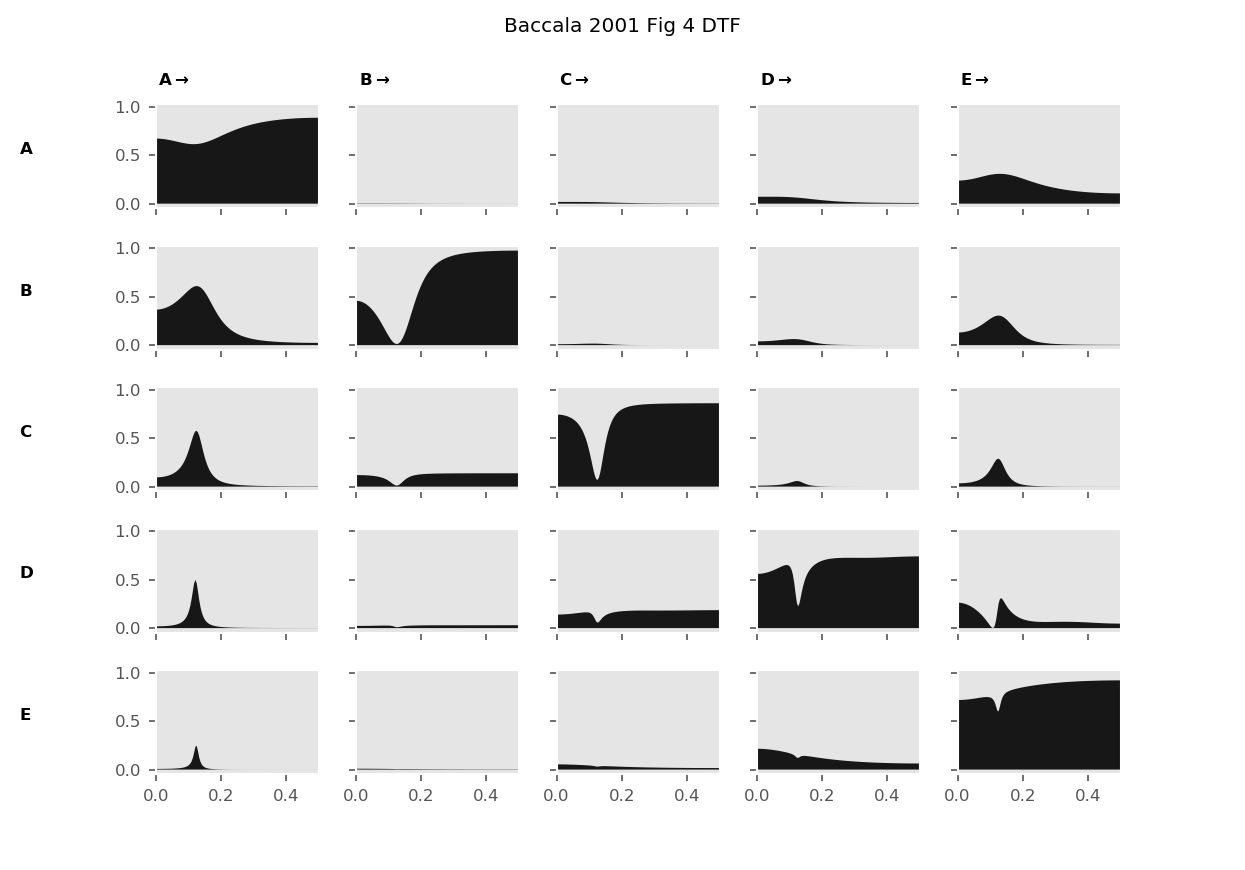
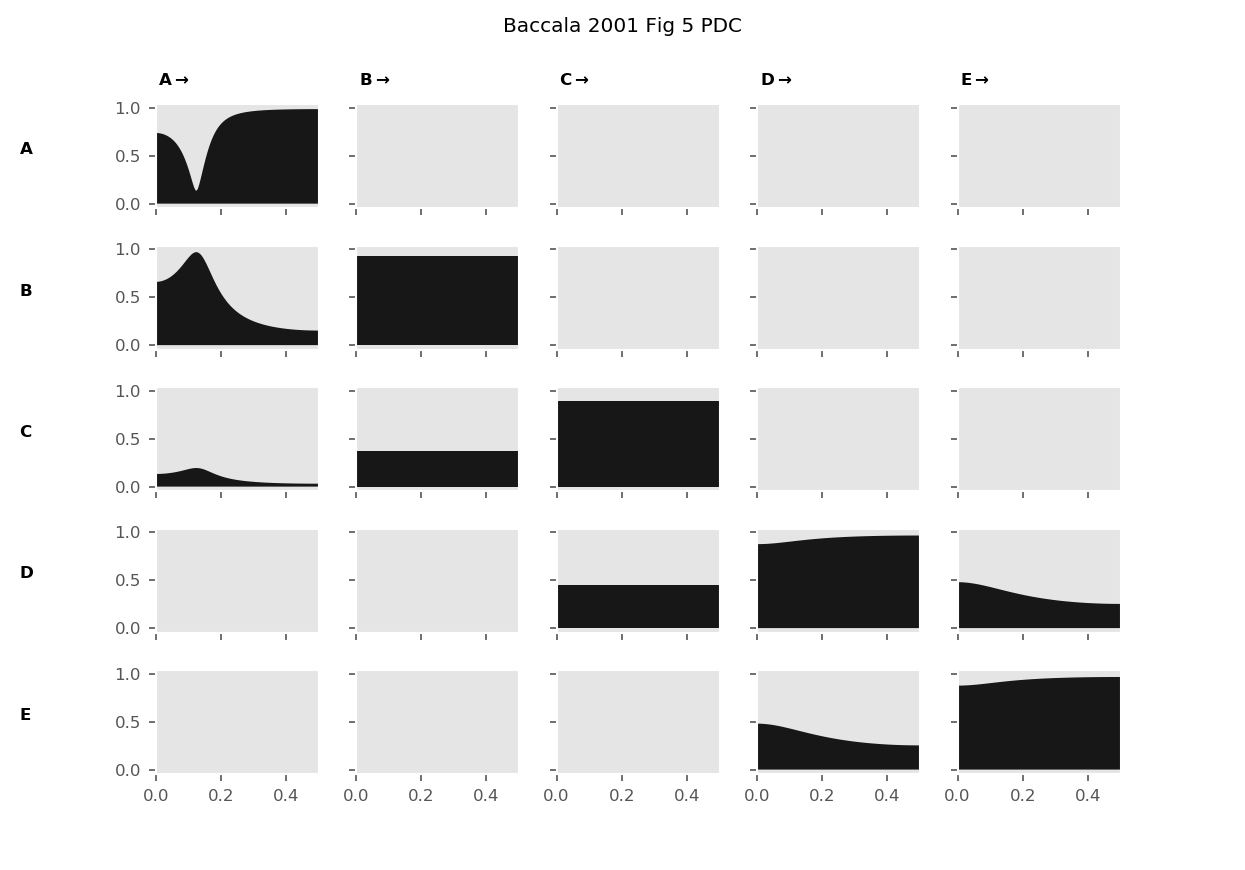
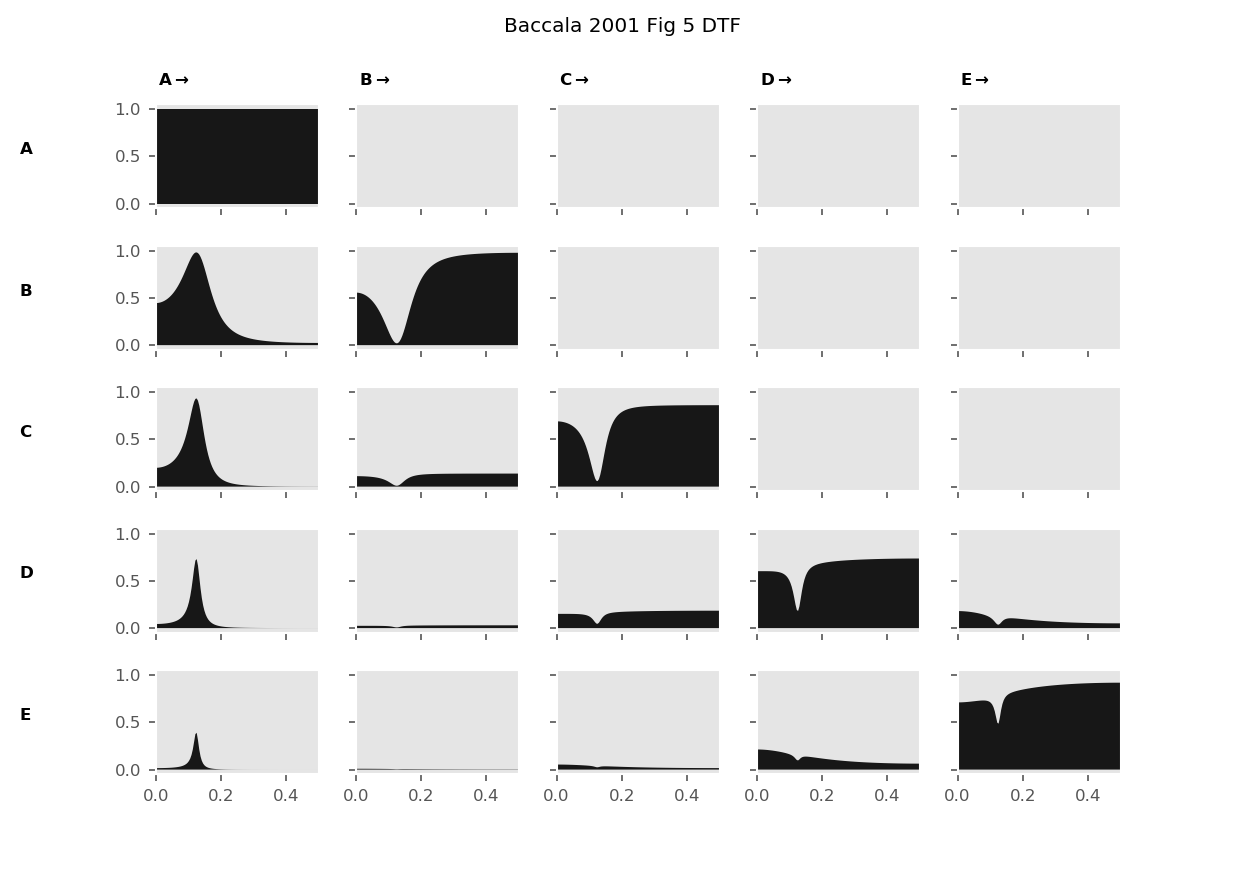
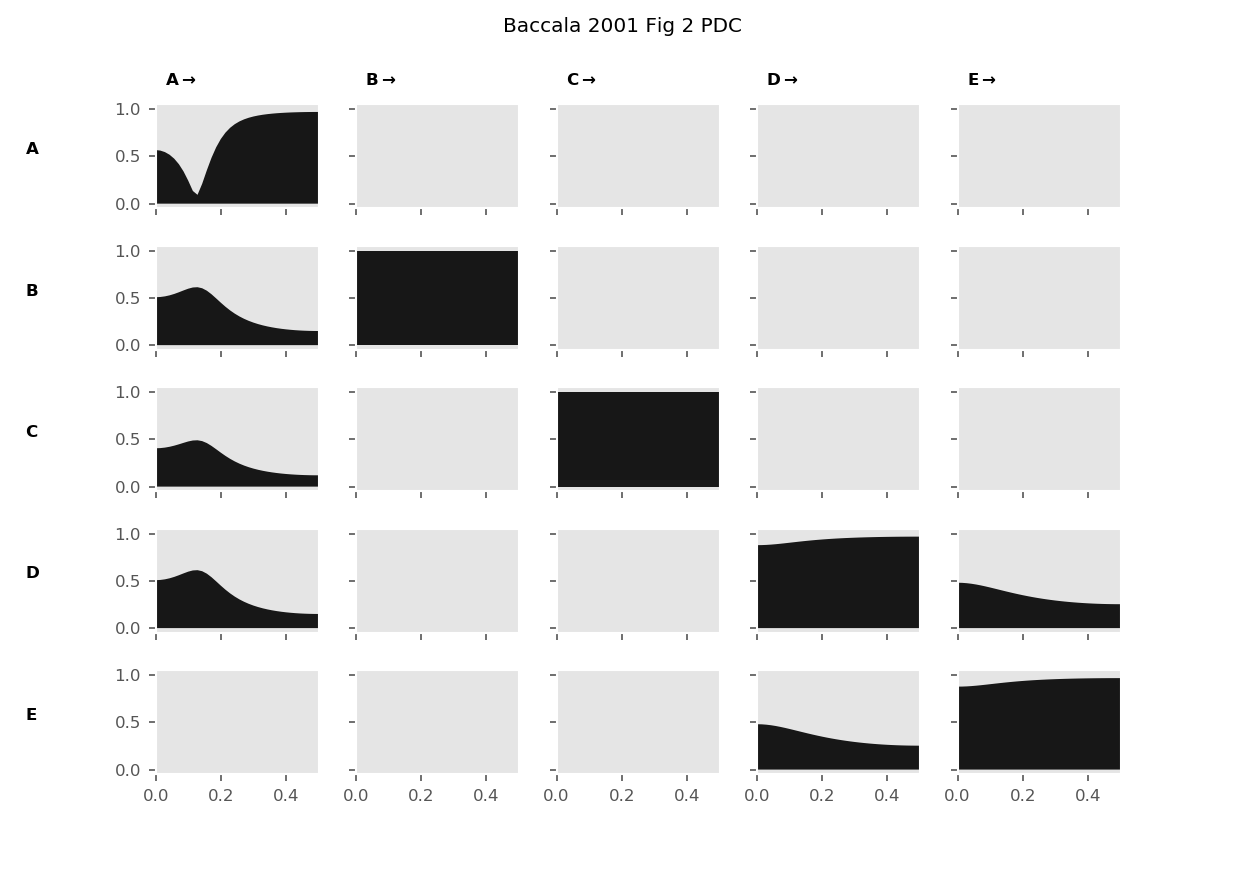
We re-create figures 1 to 5 of this paper. Each figure compares PDC and DTF connectivity estimators.
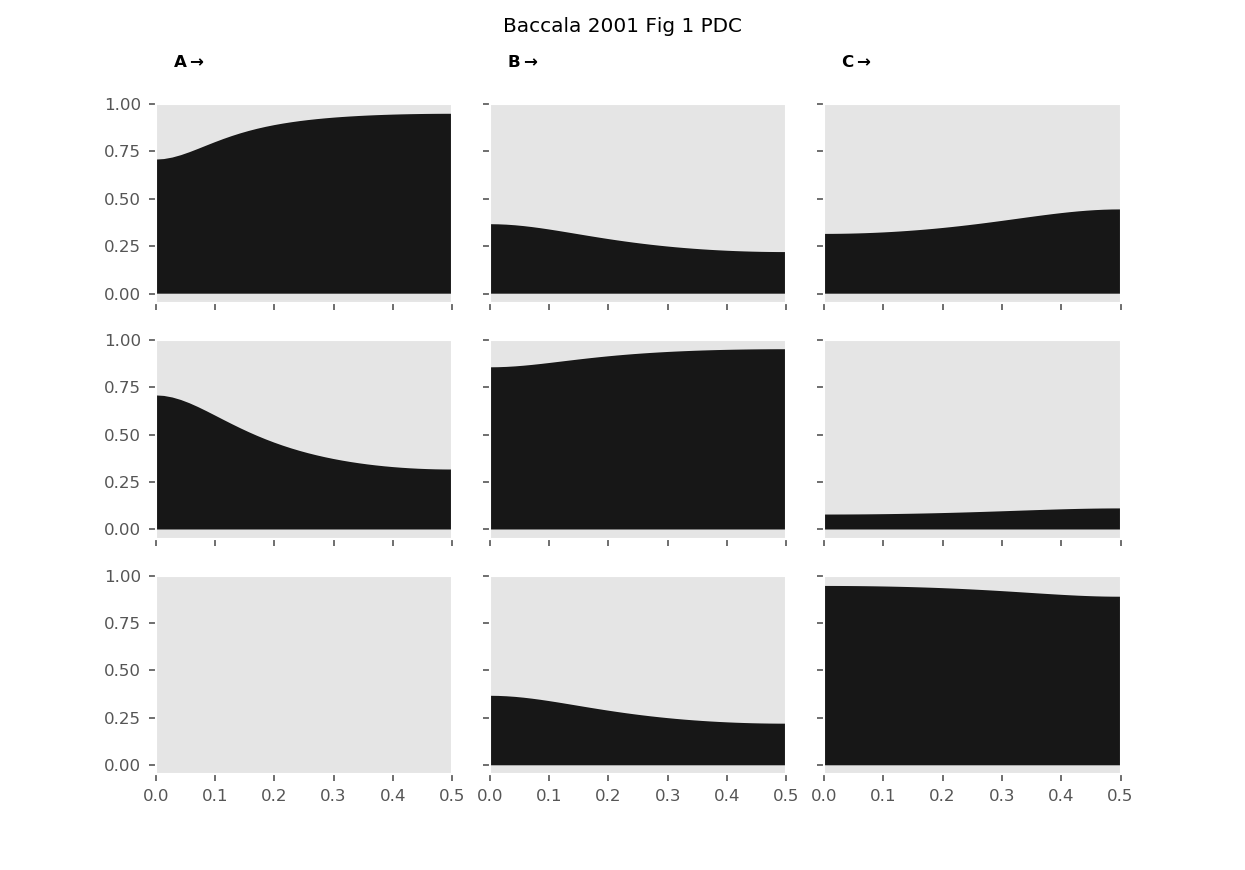
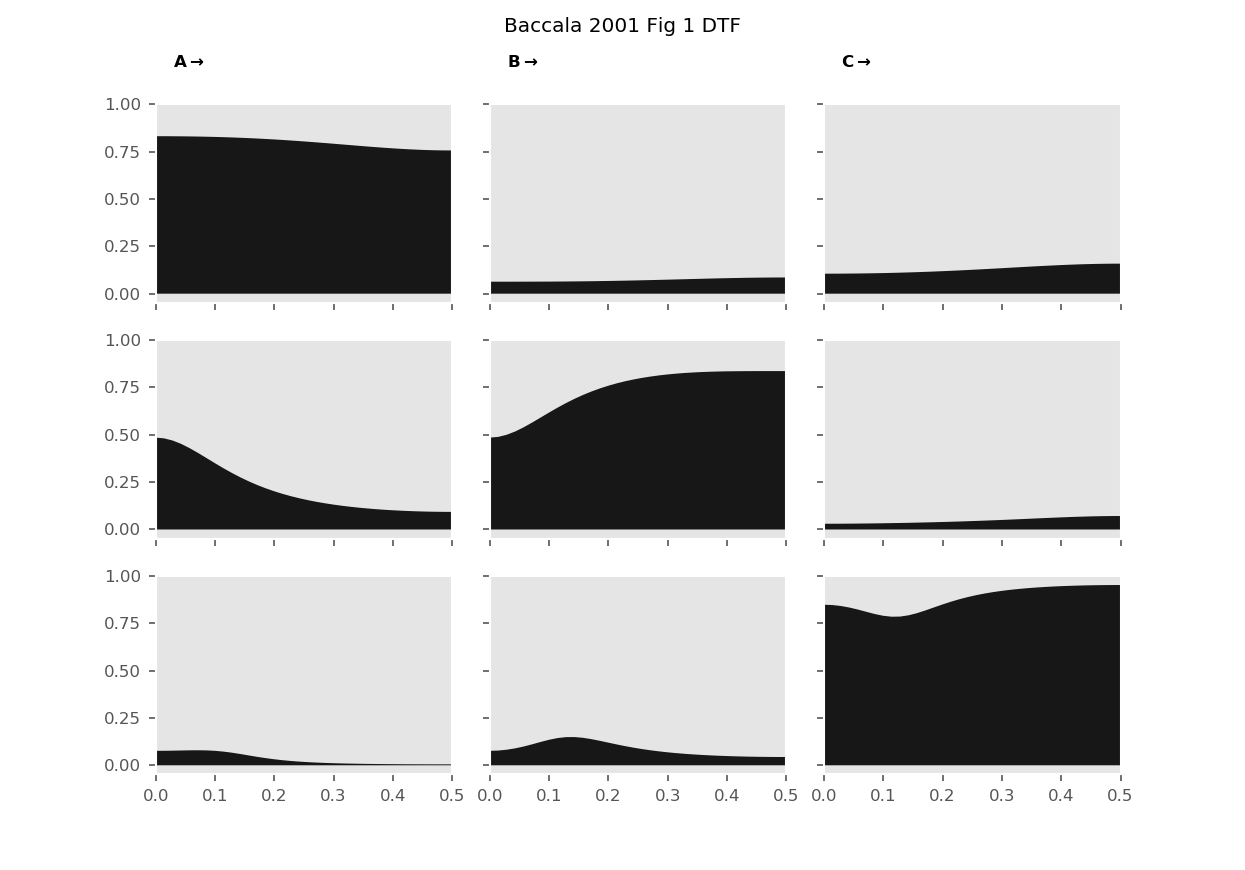
../_images/gallery_bac2001_fig1_pdc.png ../_images/gallery_bac2001_fig1_dtf.png ../_images/gallery_bac2001_fig2_pdc.png ../_images/gallery_bac2001_fig2_dtf.png ../_images/gallery_bac2001_fig3_pdc.png ../_images/gallery_bac2001_fig3_dtf.png ../_images/gallery_bac2001_fig4_pdc.png ../_images/gallery_bac2001_fig4_dtf.png ../_images/gallery_bac2001_fig5_pdc.png ../_images/gallery_bac2001_fig5_dtf.png

Pascual-Marqui et al 2014

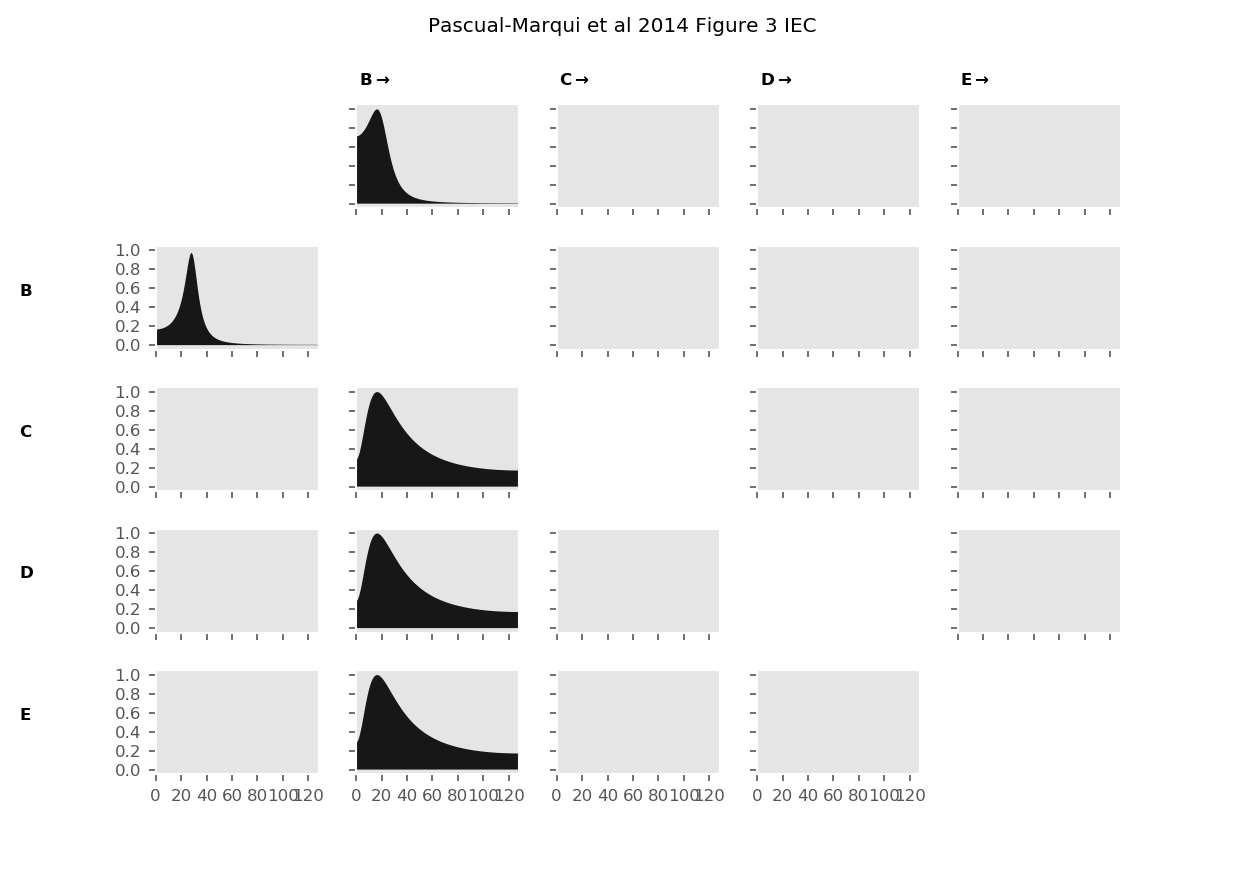
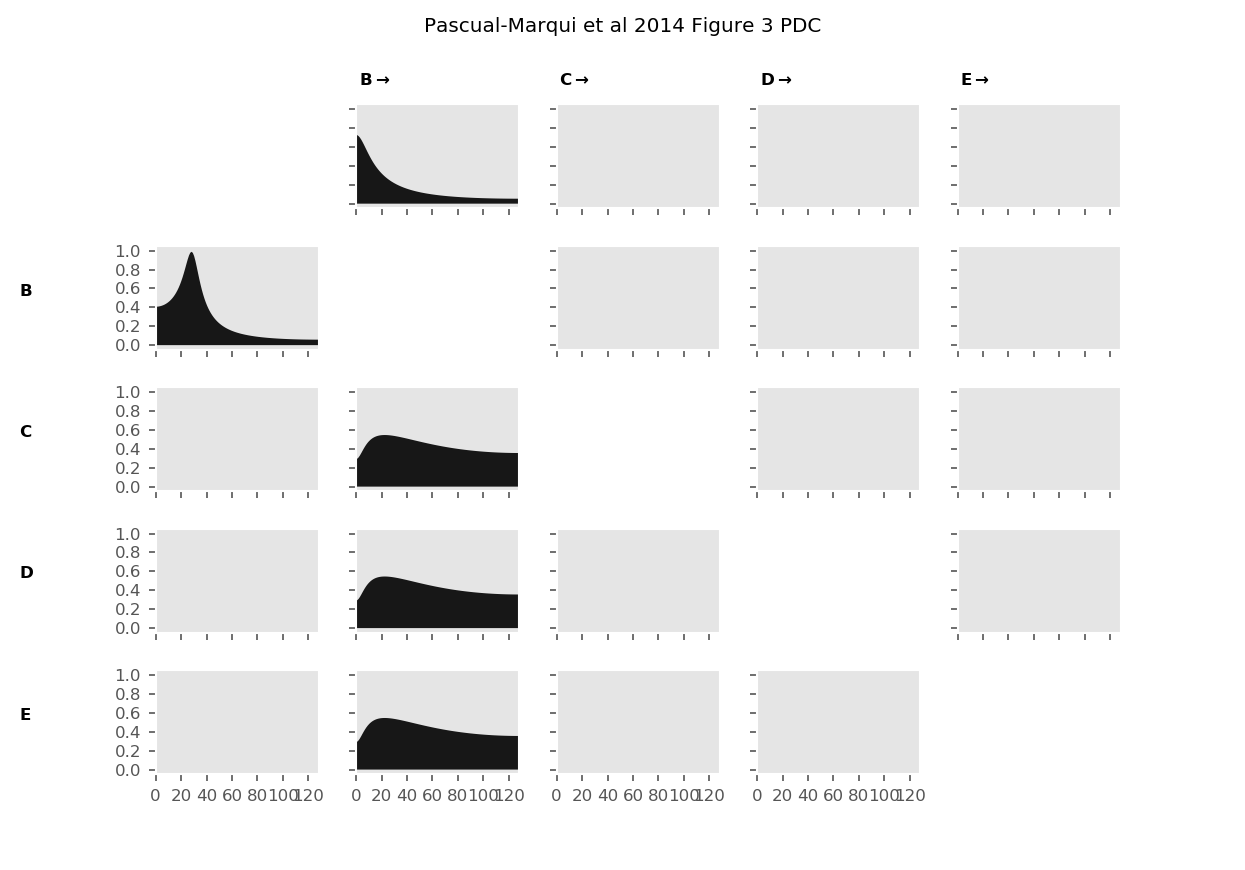
We re-create figure 3 of this paper using IEC and PDC. PDC and DTF connectivity estimators.
../_images/gallery_pm2014_fig3_iec.png ../_images/gallery_pm2014_fig3_pdc.png
Gallery API

© Copyright 2017, Andrew Quinn, Mark Hymers.

Created using Sphinx 1.8.5.